A Guide to Measuring Split Tests in Google Analytics & Other Tools
Dear readers - Long time, no see. For those of you who don’t know, I have recently become a freelance analytics and optimisation consultant. Fortunately I’ve been keeping busy :). Don’t you love working in digital right now?
Today’s guide covers an activity I perform almost daily: Measuring A/B and MVT split tests within Analytics (and other tools). Since I’m still not a fan of Google Analytics’ Content Experiments, this guide is focused squarely on integrations with awesome tools like Optimizely, Visual Website Optimizer, Cohorts.js and Adobe’s Test & Target.
OK, Yep - I hear you…:
Optimizely/Visual Website Optimizer/Test & Target already measures tests.
It does. But there are so many advantages to tracking tests in Google Analytics (or a second platform) that you mustn’t ignore it.
Here’s why…
Reason 1: All your reports, filters and tracking are pre-configured in Analytics
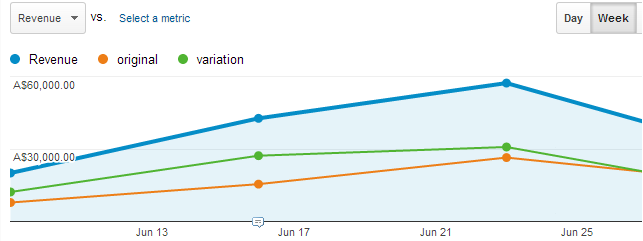
When you create tests in a particular split testing tool, you’ll need to configure it to exclude internal traffic, track specific goals and maybe even write code to track certain activities on the site (e.g. updating an on click event on a goal button). Hell - you might even have cross-domain tracking configured in GA and not in your split testing tool. I’m not even getting into all the really cool stuff you can analyse with GA either, such as linking ROI/CPA by Variations or tracking phone calls.
With your Analytics, there’s no need to set these things up - it’s likely you maintain your Analytics setup much more closely than you maintain your split testing tools.
Reason 2: Get redundancy & retroactive reporting
Can you think of a time when, in the past, you were running an experiment and someone decides to change one of the goal URLs mid-test.
Or perhaps you wanted to know how the test affected. Maybe there was an issue with your Analytics setup (e.g. report sampling) and you needed to fall back onto your split testing tool.
Wither way, if you had tracked your experiment in Google Analytics, your data would be redundant and any reports you want to see- post testing can be set up retroactively.
Reason 3: Keep your split testing tool (or agency) honest
Sure, Google Analytics isn’t perfect but nor are the tracking capabilities of the various split testing platforms out there. I’ve had all sorts of problems relying on reports from split testing tools. And rather than wasting your time calibrating your tool with A/A testing, Google Analytics will keep your testing tool honest. I promise.
In fact if I were to invest significant amounts of money performing conversion rate optimisation with an agency or contractor, I would expect nothing less than to track the results in a second tool.
Integrating your split testing tool with your web analytics tool (let’s face it, you’re running GA)
Most tools give you the ability to integrate directly with GA. If you’re not sure where to find these, check this list out:
- Optimizely
- Visual Website Optimizer
- Unbounce
- Cohorts.js does it surprisingly easily
Unfortunately the methods some of these tools use to link with GA are a bit sloppy. For instance:
Visual Website Optimizer’s method set’s the test in a visitor level custom variable that sticks around after the experiment has finished.
Optimizely sets it for the session (and won’t tag them again in the test if they return to the site in another visit and convert) - one of my main gripes about Optimizely.
Custom integrations
If you’re unlucky enough that your split testing platform doesn’t link with GA or you’re unsatisfied with the implementation of their integration, just roll your own. Below are a few common analytics integrations I use - Just replace the following variables to get it working:
{{slot}} - this is the variable number in Google Analytics. 1-5 in GA standard, 1-20 in Universal Analytics.
{{test-name}} - this is the name of the test or the test ID in your split testing platform. E.g. Wave 3
{{variation}} - this is the name of the variation in your split testing platform. E.g. Variation 1
Standard Google Analytics (Asynchronous)
Simply run the following code before the call to _trackPageview or _trackEvent:
_gaq.push(['_setCustomVar', {{slot}}, '{{test-name}}', '{{variation}}', 2]);
Hint: As long as you define the _gaq variable beforehand, you can set the custom variable well before methods like ‘_setAccount’.
Universal Analytics
Setup a session-level custom dimension in the Google Analytics back end by following the steps here and use the following code passed along with a hit (i.e. pageview, event etc).
ga('send', 'pageview', {
'dimension{{slot}}': Â '{{test-name}} {{variation}}'
});
Snowplow Analytics
This is my preferred method. If you’re using Snowplow Analytics, like me, then it’s as easy as tracking a structured event:
_snaq.push(['trackStructEvent', 'experiments', '{{test-name}}', '{{variation}}']);
When custom variables are released in Snowplow, this will be a little bit more economical than sending and additional hit for visitors in a test.
Persist the test across sessions… but don’t set a visitor-level variable
In all cases you should assign that visitor to the test for the duration of the experiment - no more, no less. This is important because, believe it or not, visitors don’t always convert on the first visit (you don’t need to be called Avinash Kaushik to know that).
As an example - What happens if you create a page that delivers an amazing experience but it only translates to additional conversions on subsequent visits to the site (e.g. you develop email or blog subscriptions)? If you don’t persist the test across visits, you won’t be able to say how awesome you are.
On the other hand, you don’t set a visitor level variable is because the data will persist for the lifetime of that visitor, making your reports jumbled and confusing (thanks goes to Yehoshua Coren of Analytics Ninja for that tip).
A note on Google Analytics’ limitations
As you saw above, Google Analytics is not quite perfect when it comes to tracking experiments (yet another reason I prefer Cohorts.js + Snowplow Analytics). Let me explain:
- Visitor arrives on your site and purchases something in their first visit.
- Visitor returns in a subsequent visit, is exposed to the test and buys nothing
The conversion in the previous visit will be attributed to the - even though the visitor simply wasn’t influenced by the split test in any way. Crazy!
This is also true of visitors converting before they’re exposed to the test - within the same visit!
Fortunately, this is solved with Google Analytics’ new segments by the sequencing feature. E.g. Exposed to the test first, then converted.
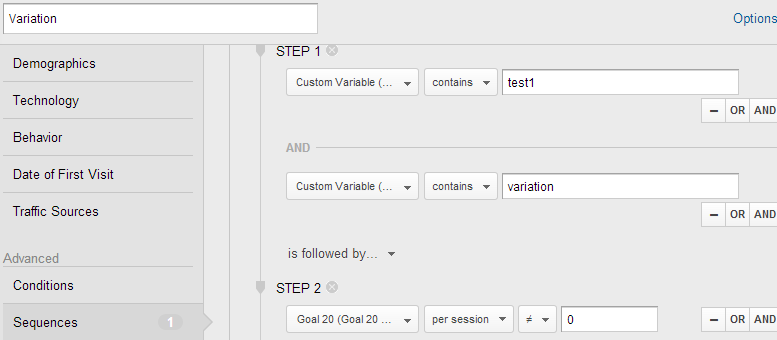
Using GA’s sequence segmentation feature, you can reliably determine the causal influence of the metric on unique visitors.
This is only necessary when you’re faced with deep conversion paths or when you’re monitoring micro-conversions which can be triggered before a user is exposed to the test.
Analysing the test data from GA
Once you’re collecting split test data in your preferred analytics tool, you should start to see the data shortly.
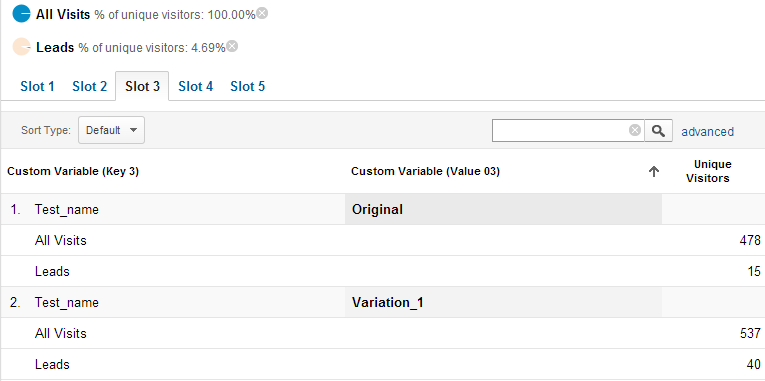
For our purposes, we want to view unique visitors to the test and how many converted. This is because the statistical methods used for significance testing relies on binomial data. In cave man speak it means:
- Visitor doesn’t convert = 0 conversions
- Visitor converted 1 time = 1 unique conversion
- Visitor converted 3 times = 1 unique conversion
It’s non-trivial to get the data we’d need to make inferences about session-level metrics. And since Google Analytics’ reports are largely session based (unless you have some crazy sessionisation), you’ll want to use this custom report:
Download and follow the prompts to add it to your respective version of GA
Universal GA (This you’ll need to set up yourself - I don’t know your custom dimensions setup)
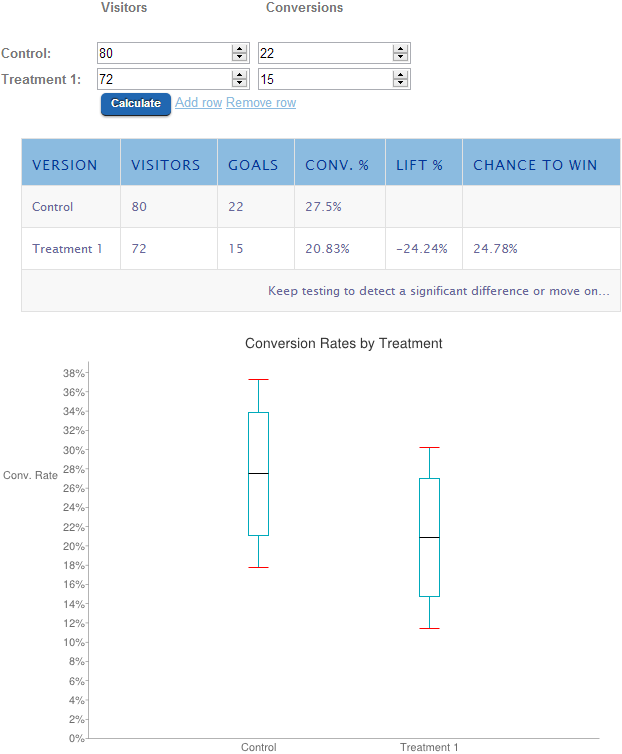
Just apply two segments to the data - “All visits” and “Visits with conversions” (note, you could try anything here). Take the values and pop them into your favourite statistical significance calculator.
Visit my split test significance calculator here.
You’ll want to pay attention to factors that influence the validity of your experiments, too.
Help! Dingoes Report sampling ate my baby…
A word of caution for those that commonly see report sampling.
This nasty little bugger can significantly impact the validity of your experiments. In tests where I’ve encountered report sampling, I’ve watched as variations with 60% confidence magically switch to 95% confidence overnight.
Unfortunately, to my knowledge, there is no way to get around report sampling in your experiments, other than to buy GA Premium (worth it if you have US$150,000 laying around - hey, who doesn’t?). Not even walking through the data a day at a time in the API can save you. If you recall, we’re using unique visitors - they are unique visitors to the day you’re looking at: therefore, if you look at three individual days, you may see 3 unique visitors as opposed to 1 unique vistor when you look at the three days cumulatively.
For clients who are in danger of report sampling for their experiments, I spend much more time ensuring the settings in the split testing tool are accurate. I’ve even begun tracking experiments in Snowplow Analytics (a spectacular open source analytics platform).






Robert, do you think the sampling is that much of an issue? If you get unsampled data by running the query day by day, you get to “accurate” numbers of other metrics that are relevant for your (revenue, number of transactions, average order value etc.). Would it be sufficient then to have a total unique visitor number (for the whole time that the test was running) and calculate conversion rates etc.?
You make an excellent point, Pedro. I too take this approach of mixing “day-by-day conversion data” with “visitor data for the whole period.” But if it’s a conversion point where people are likely to convert multiple times in a month, then it falls apart.
It’s at that point I have to lean on other supporting data - which sucks because clients want to know the results for the key test criteria.
Have you been measuring experiments in GA, Pedro?
Brilliant post!
Thank you!