Build a Conversion Rate Heatmap by Hour & Day of Week in Google Docs
Update 5th January 2013: Regretfully, Google discontinued the API that Mikael’s excellent script is based upon - and therefore this approach is broken. You can still do it manually - it’s just as fast!
Read my original post on how to create a heatmaps of analytics data here.
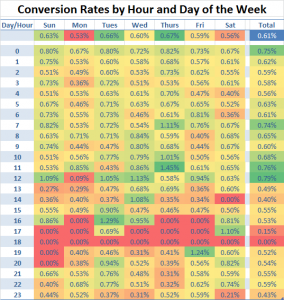
Thanks to a smart Finn called Mikael Thuneberg, I’ve managed to whip up a quick and dirty little Google Docs template which builds these Google Analytics heatmaps in seconds (much easier and faster than the old method):
How it works
Basically Mikael Thuneberg developed some JavaScripts that pull GA data from the GA API into Google Docs. All the code is readily available for you to inspect here and inside my template.
How to do it
IMPORTANT: Google disabled the API, so please read my old post on the manual heatmap method (it’s still reasonably quick :).
Watch the instructional video below (I’m a YouTube newbie, so you may have to bear with it) or follow the steps outlined afterwards.
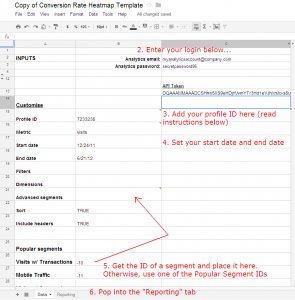
Step 2: Pop in your username and password, into the fields on the “Data” spreadsheet tab. Feel free to hide your password in the spreadsheet.
Step 3: Grab your Profile ID (Note that this is not your UA number!) from the URL in your Google Analytics interface and pop it into the corresponding cell in the template. You’re looking for the number in the URL which looks like this:
https://www.google.com/analytics/web/?pli=1#report/visitors-overview/a5147757w23349371p21652238/
Therefore, you would use “21652238” in the spreadsheet.
Step 4: Set your date range - you’ll want a decent date range so that you have a couple of hundred thousand visits at least.
Step 5: Pop the ID of an advanced segment into the spreadsheet. Some are already provided under the inputs area. Otherwise “-9″ will work for most sites with goals setup.
Step 6: Jump into the reporting tab at the bottom of the screen.
Step 7: Copy the tables you’d like to use and pop them into Excel, and dress them up in a table with conditional formatting.
Either download my example conversion rate heatmap template for Excel or use conditional formatting and table formatting icons up in the ribbon (note you’ll need Excel 2007 for this):
Done!
Whereas the old process would have taken 30-60 mins to aggregate in the GA interface, this less than 5 minutes - and much faster with several cups of coffee.


Thanks for this great instructional video! I am trying to set this up now, but see a few squares in the ration section that have an “error” code in them that says #DIV/0!. Do you know what this means? I did have some N/As, and changed them to 0, but otherwise, it seems that the data is pulling correctly.
Thanks,
Kristen
Nevermind:). I just changed those to 0s and I think that was the problem.
Not a problem, Kristen… if you do have any issues with it, give me a bell.
The top table is calculated using the two bottom tables: 2nd table divided by the 3rd table. It’s handy for spotting errors.
Hi there, when clicking on your link to load the template, I am redirected to Google Drive, and nothing else happens after that. I tried searching for Conversion Rate Heatmap in Drive, to no avail…
Can you help?
Thanks!
Hi Rob,
Just stumbled across your site. Great tips!
Any other excel / dashboard tips for analytics newbies? Or links to any good pivots that I can dump a load of analytics data into and click refresh to produce amazing insights?
Cheers,
Jim
Jean-Marie:
The company I am at has not switched to Google Drive yet for documents. I used this URL to get the template:
https://docs.google.com/templates?q=Conversion+Rate+Heatmap
Try that out.
Judging from his name, Thuneberg is not a Finn, but a Finland Swede (http://en.wikipedia.org/wiki/Swedish-speaking_population_of_Finland), or finlandssvensk in Swedish.
@Jean-Marie - I’m not able to recreate the error for you. Did sharing it directly help? If not, did Sean’s link help?
@Jim - Thanks, glad you like it. I haven’t posted anything on dashboards at all, but if you’re into Excel dashboards for GA, I highly recommend you look at Mikael Thuneberg’s site: http://www.automateanalytics.com/
Dashboards is definitely something that I’d like to get into, though.
@Olle - Very astute… My (Finnish) girlfriend said he might consider himself a Finland Swede too, but after your comment I decided I’d ask the man himself: https://twitter.com/MTAnalytics/status/227685406836129792
How do you as a marketeer use this info?
AWESOME SAUCE!
@Niller, Pretty simply really - it’s particularly for day parting in AdWords, or deciding when it’s best to send out an email.
It can also show you when you receive a great volume of traffic or when mobile visitors browse your site as opposed to non-mobile visitors (this is a combination I sometimes like to use).
It’s also a good way to spot when you should run offers (during the red times, to inspire purchases).
As Justin Cutroni mentioned, basically do less of the red and opt for more green:
Great list, will test it!
Hello,
I’ve an issue with the Google Doc. I’m using the right email and password, but it asks for a Captcha…
“Complete CAPTCHA at http://www.google.com/accounts/Captcha?ctoken=xxxxxxx
Error=CaptchaRequired
Url=https://www.google.com/accounts/ErrorMsg?Email=xxxxxxxx”
Really interesting, but according to Mikael, Google will stop the use of the API in a near future…
@Daniel Roch - Sounds like it’s checking whether or not you’re human. Are you accessing the internet through a proxy? Could you login to GA elsewhere and if so, do you see a CAPTCHA?
Try again if you complete the CAPTCHA when logging into GA through your normal browser.
@Julien - Interesting. Will have to cross that bridge when we get there. In the meantime, Mikael (or perhaps someone else) may provide a Google Docs script for the new API.
I would look into modifying the script to work with the new API myself but A) my JS is still somewhat limited B) Will need Mikael’s permission to redistribute the script.
I apologize if this is a stupid question, but I am stuck at the point where you paste the data into Excel. How do I apply the conditional formatting you have already set up? Where do I paste the Reporting data?
Many thanks - this is a great idea.
Eileen
This is brilliant! I’m trying to use the filter field to restrict traffic to the UK, and can’t get it to work — i’ve tried “ga:country%3D%3DUnited%20Kingdom” and “ga:country==United%20Kingdom” and neither are working - do you have some examples of filters and dimensions?
@Eileen, which version of Excel are you running? This will only work with versions 2007 and above as far as I know.
If you’re running Excel 2007 or above, look for the “Conditional Formatting” button in the “Styles” section underneath the “Home” tab. Otherwise, you should be able to do this with my template that I provided (albeit it won’t match up 100%). Let me know if that helps, Eileen.
@Danae, excellent question. Unfortunately, I’ve used the filter fields to extract the hour and day of week data.
If you like to do this you would need to setup 2 advanced segments and copy the 2nd table into another spreadsheet to work out conversion rates. i.e.
1. UK Traffic
2. UK Conversions/Sales/Mobiles/etc
You would apply one advanced segment, copy the second table (“Goals”) in the reporting tab and then apply the other advanced segment and copy the results in the 2nd table in the reporting tab. Once that’s done, you should be able to calculate the conversion rate between the two tables:
UK Conversions / UK Traffic
Does that make sense?
Thanks Robert, that does make sense!
The data is populating but there are several full days for ratio, goals , and visits that are not showing up and giving me a #N/A for certain days. Which dimensions should I be sure to have included? Do I need to always change the date range and metric when I change them on analytics? Do I need to change anything from Column E over
@ Matt you shouldn’t need to change anything except for the profile, date range and advanced segment.
If you’re seeing #N/A errors, that seems to be an issue with GDocs, the script or API. Try the following steps to correct it:
1. Check that it’s the right profile
2. Check that you have data for the date range specified
3. Make sure the Advanced segment is reporting data for the date range
4. Look at the bottom two tables in the reporting tab and make sure you’re not getting #N/A errors in those.
5. If you still have NA errors, simply hit refresh on the page and the script will run once more.
Thanks, very useful resource.
Robert,
I’ve had the same issue like Matt. Used the googledoc several times from scratch. There is data, but the visits table is just showing N/A for a few days in the week…
Hey Vincent,
Thanks for reaching out. I take it you tried my suggestions above.
- Do all three tables in the reporting tab have N/A?
- Have you tried refreshing the window? I.e. hitting ‘F5′
One possibility, that will be harder to debug, is whether or not the number of API hits exceeded GA’s maximum. Try unhiding the rows and columns on the spreadsheet and looking for any errors in the days’ or hours’ data.
If nothing else, please email me the errors (taking care that you don’t copy any sensitive information to me) rob@{my site’s domain name}.
Hi Rob,
I have exactly the same issue like Matt. I tried that you recommend but I have still the issue…
@ Jerome, please email me. Should be a quick fix.
Cheers,
Rob
Hi, for those who just want to take a quick peek into the data. We took the mentioned report for an experiment and build a webservice using the Core Reporting API (v3). Visit http://ga.cmm-hq.com ,log-in with your GA credentials and choose a goal .. Thats all…
Nothing more than a quick workaround.. Cheers CMM
Robert - I’ve completed the implementation however the 2nd and 3rd tables either show visits when i have ‘visits’ in the B16 ‘Metrics’ cell, or they both show ‘transactions’ when i input that into the cell. How can i have visits remain in the 3rd table to then have the first calculate the conversion rate?
Rob, brilliant tool! Thanks for sharing, but I had the same issue as some of the other guys, for the visits with conversion segment, it doesn’t seem to be able to get data for Sundays, same issue for Mobile traffic as well. Any idea why? Thanks!
Hi Wenting, Thanks - glad you like the idea. Unfortunately it stopped working due to the API. Will update it once I have time to post another solution - trust me when I say there’s plenty of ways to do this.
Hey Wenting, I’ve updated this now - you may like to check this out here: http://www.optimisationbeacon.com/analytics/visualize-your-conversion-rate-by-hour-day-of-the-week/
It’s just as speedy as the method above, once you get the hang of it.
Wow, this post is nice, my sister is analyzing
such things, thus I am going to inform her.